Note
Access to this page requires authorization. You can try signing in or changing directories.
Access to this page requires authorization. You can try changing directories.
This article describes the code of the Custom DevTools sample. To first install and run the sample, see Sample: Custom DevTools tool.
Introduction
Like a regular extension, a DevTools extension has a manifest file. That's described in Get started developing an extension, which presents a basic extension sample that you can start with.
An extension that extends DevTools additionally includes:
- A rendered HTML file to display in the tool's panel in DevTools.
- A non-rendered HTML file that runs when DevTools is opened, and which typically handles communication between the custom DevTools tool and the inspected webpage.
This DevTools extension sample communicates between DevTools and the inspected webpage, and calls DevTools APIs.
The DevTools Extension sample displays a custom tool in DevTools, including a Custom tab in the Activity Bar and a panel that's connected to the tab:
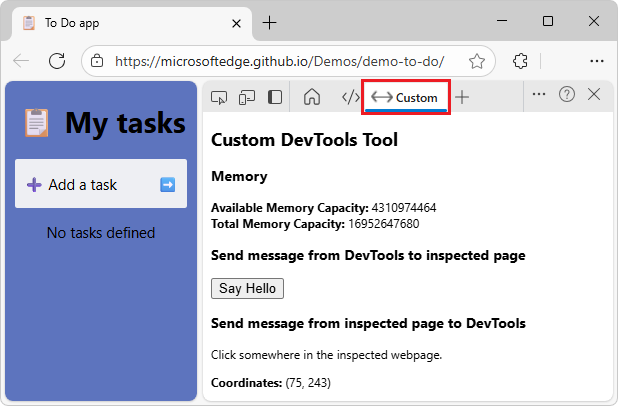
A panel is a tool page in Microsoft Edge DevTools, along with the tool's tab in the Activity Bar.
See also:
Overview of files
The DevTools extension sample has the following files:
| File | Description |
|---|---|
manifest.json |
Information about the extension: name, description, version, manifest version, and HTML page to show in DevTools. |
panel.html |
Webpage to display in the custom panel in DevTools. |
devtools.html |
A non-rendered HTML file that's run when DevTools is opened, to load the extension's JavaScript files. |
devtools.js |
Main logic for the custom DevTools page. |
content_script.js |
Code which the extension injects in the inspected webpage. Adds a click event listener to the page that will send a message with the mouse-click position. devtools.js listens to this message and displays the position in the custom panel. |
icon.png |
Icon to display on the tool's tab in the Activity bar of DevTools and in the More tools menu. |
README.md |
Basic information for developers about how to use the sample. |
Details are below.
Interact between the webpage and DevTools
Multiple files are needed to enable interaction between the inspected webpage and DevTools. These files run in different contexts:
devtools.jsruns in the context of the custom tool panel, in DevTools.content_script.jsis a content script, which means that it runs in the context of the inspected webpage. In the same way that other scripts are loaded by the webpage, a content script has access to the DOM and can change it.
The DevTools page, inspected page, and content script fit together in an extension:

The content_script.js detects where the user clicks on the inspected webpage:
document.addEventListener("click", event => {
  chrome.runtime.sendMessage({
    click: true,
    xPosition: event.clientX + document.body.scrollLeft,
    yPosition: event.clientY + document.body.scrollTop
  });
});
The content script relays this info to the devtools.js file, where the data is displayed in DevTools in the Custom tool and in the Console tool.
Detect the user clicks on a webpage by using a content script. The content script relays this info to the devtools.js file, where the data is displayed in both the DevTools Console and the DevTools Custom tool that's a Microsoft Edge extension.
Code for Custom DevTools tool
The Custom DevTools sample consists of the following files and code. The code that interacts with the inspected webpage does the following:
Displays memory information in the Custom DevTools tool.
Displays the mouse-click position in the Custom DevTools tool, when the webpage is clicked.
Displays a greeting alert in the inspected webpage, when the Say Hello button is clicked in the Custom DevTools tool.
manifest.json
Information about the extension: name, description, version, manifest version, and HTML page to show in DevTools.
The manifest file contains key/value pairs. The top-level keys are called members.
This file is required, for an extension. The manifest contains the following information about the extension:
| Member | Description |
|---|---|
name |
The name of the extension that will appear under edge://extensions/. |
description |
The description of the extension that will be displayed under the name of the extension. |
version |
The version of the extension that will appear next to the name of the extension. |
manifest_version |
Determines the set of features that the extension will be using, such as network request modification. The current version is version 3. To learn more about this version and the differences with version 2, see Overview and timelines for migrating to Manifest V3. |
devtools_page |
The path to an HTML file that's run every time DevTools is opened, and loads the extension's JavaScript files. This page isn't rendered in DevTools. |
content_scripts |
The JavaScript or CSS files to use when the user opens specified webpages. See Content scripts in the Chrome docs. |
permissions |
The local device requires permissions to view its system memory capacity, since the script calls API for that. |
manifest.json:
{
    "name": "Custom DevTools Tool",
    "description": "A DevTools extension interacting with the inspected page",
    "manifest_version": 3,
    "version": "1.0",
    "devtools_page": "devtools.html",
    "content_scripts": [{
        "matches": [
            "http://*/*",
            "https://*/*"
        ],
        "run_at": "document_idle",
        "js": [
            "content_script.js"
        ]
    }],
    "permissions": [
        "system.memory"
    ]
}
The permissions manifest member in manifest.json defines which permissions the extension requires from the user. Some permissions are needed to use certain extension APIs. The system-memory permission is required, in order to use the extension APIs. Specific APIs have associated permissions.
Keys within the content_scripts member:
| Key | Value |
|---|---|
matches |
Specifies which pages this content script will be injected into. |
run_at |
Indicates when the browser injects the script onto the page. |
js |
The javascript files to be injected. |
See also:
- manifest.json - source file in repo.
- Extensions API reference
panel.html
Webpage to display in the custom panel in DevTools.
This file is required. This is the webpage to display in the custom panel in DevTools.
panel.html:
<!DOCTYPE html>
<html>
  <head>
    <meta charset="UTF-8" />
  </head>
  <body>
    <h2>Custom DevTools tool</h2>

    <h3>Memory</h3>
    <div>
      <b>Available Memory Capacity:</b> <span id="availableMemoryCapacity"></span>
    </div>
    <div>
      <b>Total Memory Capacity:</b> <span id="totalMemoryCapacity"></span>
    </div>

    <h3>Send message from DevTools to inspected page</h3>
    <input type="button" id="sayHello" value="Say hello to the inspected page">
    <h3>Send message from inspected page to DevTools</h3>
    <p>Click somewhere in the inspected webpage.</p>
    <div>
      <b>Coordinates:</b> <span id="youClickedOn"></span>
    </div>

  </body>
</html>
panel.html is referenced in the chrome.devtools.panels.create method call in devtools.js. The panel.html webpage contains the user interface of the custom tool's panel.
The above elements demonstrate the interaction between the inspected page and the DevTools panel.
When the user clicks the sayHello button in the DevTools extension, an alert is displayed in the inspected window.
When the user clicks anywhere in the inspected page, the mouse-click coordinates are displayed in the DevTools custom tool.
See also:
- panel.html - source file in repo.
devtools.html
A non-rendered HTML file that's run when DevTools is opened. This file is required.
The file name devtools.html must match the value of the devtools_page member in the manifest file.
devtools.html contains a <script> element which loads devtools.js:
devtools.html:
<!DOCTYPE html>
<html>
  <head>
    <meta charset="UTF-8" />
  </head>
  <body>
    <script src="devtools.js"></script>
  </body>
</html>
See also:
- devtools.html - source file in repo.
devtools.js
devtools.js contains the main logic for the custom DevTools page. devtools.js does the following:
Creates a new Custom tool tab and panel in DevTools by using
chrome.devtools.panels.create().When the tool is displayed (
panel.onShownlistener), theavailableMemoryCapacityandtotalMemoryCapacityelements are retrieved from the DOM.Sets a timer to run code every second after the panel is shown.
When the timer fires, the
chrome.system.memory.getInfomethod is used to retrieve the available and total memory capacity of the device and these values are displayed in the corresponding DOM elements.
devtools.js:
let availableMemoryCapacity;
let totalMemoryCapacity;
let youClickedOn;

chrome.devtools.panels.create("Custom", "icon.png", "panel.html", panel => {
    // Code invoked on panel creation.
    panel.onShown.addListener( (extPanelWindow) => {
        // Memory API.
        availableMemoryCapacity = extPanelWindow.document.querySelector('#availableMemoryCapacity');
        totalMemoryCapacity = extPanelWindow.document.querySelector('#totalMemoryCapacity');
        // 2-way message sending.
        let sayHello = extPanelWindow.document.querySelector('#sayHello');
        youClickedOn = extPanelWindow.document.querySelector('#youClickedOn');
        sayHello.addEventListener("click", () => {
            // show a greeting alert in the inspected page
            chrome.devtools.inspectedWindow.eval('alert("Hello from the DevTools extension!");');
        });
    });
});

// Update the Memory display.
setInterval(() => {
    chrome.system.memory.getInfo((data) => {
        if (availableMemoryCapacity) {
            availableMemoryCapacity.innerHTML = data.availableCapacity;
        }
        if (totalMemoryCapacity) {
            totalMemoryCapacity.innerHTML = data.capacity;
        }
    });
}, 1000);

// Send a message from the inspected page to DevTools.
chrome.runtime.onMessage.addListener((request, sender, sendResponse) => {
    // Messages from content scripts should have sender.tab set.
    if (sender.tab && request.click == true) {
        console.log('I am here!');
        if (youClickedOn) {
            youClickedOn.innerHTML = `(${request.xPosition}, ${request.yPosition})`;
        }
        sendResponse({
            xPosition: request.xPosition,
            yPosition: request.yPosition
        });
    }
});
The create method call in devtools.js:
chrome.devtools.panels.create("Custom", "icon.png", "panel.html", panel => {
    // code invoked on panel creation
});
The create method has the following signature:
chrome.devtools.panels.create(
    title: string, // Tool tab's label in Activity bar.
    iconPath: string, // Icon to display in tool's tab.
    pagePath: string, // Webpage to display in tool's panel.
    callback: function // Code to run when tool is opened.
)
To communicate with the inspected webpage, devtools.js adds event listeners to the sayHello button and youClickedOn label that's defined in the panel.html file.
When the user clicks the sayHello button, devtools.js runs code directly in the inspected window, by using the chrome.devtools.inspectedWindow.eval() method.
When the user clicks anywhere in the inspected window, the DevTools extensions receive a message with request.click == true and the mouse position information.
See also:
- devtools.js - source file in repo.
- Supported APIs for Microsoft Edge extensions
content_script.js
Code which the custom DevTools tool injects in the inspected webpage. Contains JavaScript that's injected into the inspected webpage (any webpage).
This file does the following:
- Adds a click event listener to the inspected webpage, that sends a message containing the mouse-click position, by calling
chrome.runtime.sendMessage. - Listens for the page click event via an event listener.
The content script relays the mouse-click coordinates to the devtools.js file, where the coordinates are displayed in both the Console tool and the Custom tool in DevTools.
A content script runs in the context of the inspected webpage. In the same way that other scripts are loaded by the webpage, a content script has access to the DOM and can change it.
content_script.js:
document.addEventListener("click", (event) => {
  chrome.runtime.sendMessage({
      click: true,
      xPosition: event.clientX + document.body.scrollLeft,
      yPosition: event.clientY + document.body.scrollTop
    },
    response => {
      console.log("Received response", response);
    }
  );
});
See also:
- content_script.js - source file in repo.
- Content scripts - Chrome docs.
icon.png
Icon to display on the tool's tab in the Activity bar of DevTools and in the More tools menu.
icon.png is the icon to display on the tool's tab in the Activity bar of DevTools and in the More tools menu:
![]()
See also:
- icon.png - source file in repo.
See also
- Sample: Custom DevTools tool
- Overview of DevTools
- Overview and timelines for migrating to Manifest V3
- Supported APIs for Microsoft Edge extensions
- Get started developing an extension
- Sample: Picture viewer pop-up webpage
Chrome Extensions docs:
Source files in repo: