Note
Access to this page requires authorization. You can try signing in or changing directories.
Access to this page requires authorization. You can try changing directories.
In this tutorial, you learn how to use Microsoft Fabric to prepare, load, and model data for Power BI reporting. You use Dataflows Gen2 to ingest and transform data into a lakehouse, orchestrate data refreshes with data pipelines, and build a dimensional model that uses Direct Lake mode to read data directly from the lakehouse without importing it. Finally, you automatically generate a report to visualize the latest sales data.
In this tutorial, you:
- Prepare and load data into a lakehouse
- Orchestrate a data pipeline to refresh data and send an email on failure
- Create a semantic model in the lakehouse
- Automatically create a report with quick create
Prerequisites
- Fabric enabled for your organization.
- A Power BI account. If you don't have one, sign up for a free trial.
- A workspace with Fabric capacity assigned. A nonproduction workspace is recommended for this tutorial.
- The Power Query template file containing sample queries for Contoso data.
Create a lakehouse to store data
Start by creating a lakehouse to store your data. Use Dataflows Gen2 to prepare and transform the data, and use a pipeline to orchestrate scheduled refreshes and email notifications.
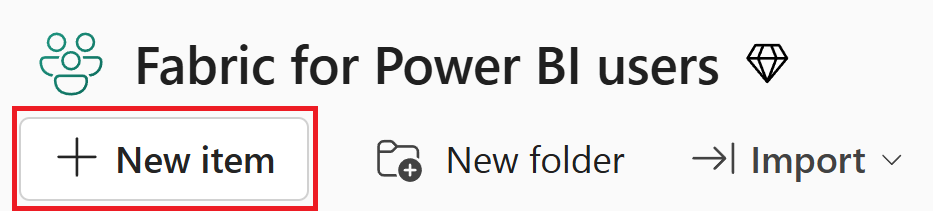
In your workspace, select New item at the top of the page.
On the New item creation screen, search for or select Lakehouse.

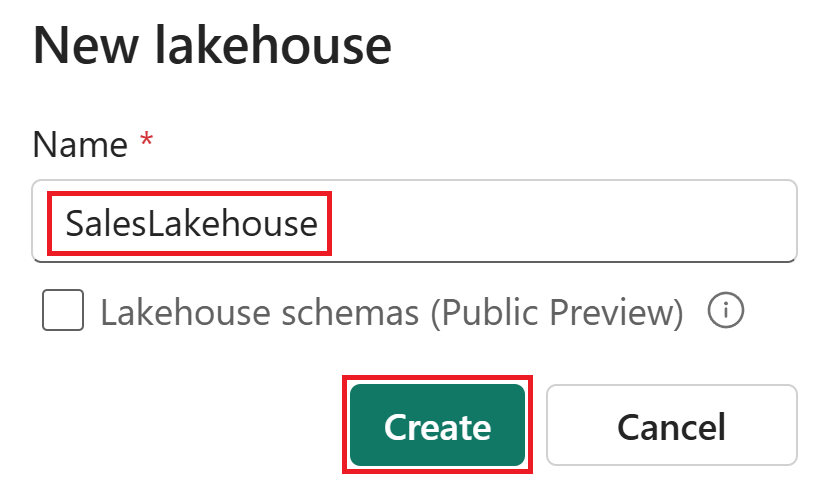
Enter SalesLakehouse as the name (names can include letters, numbers, and underscores, but not special characters or spaces), and then select Create.
In the Lakehouse editor, select New Dataflow Gen2 from the ribbon. Alternatively, select Get data from the ribbon, and then choose New Dataflow Gen2.

Name the dataflow OnlineSalesDataflow (use only letters, numbers, and underscores), and then select Create.
Prepare and load data into the lakehouse by using Dataflows Gen2
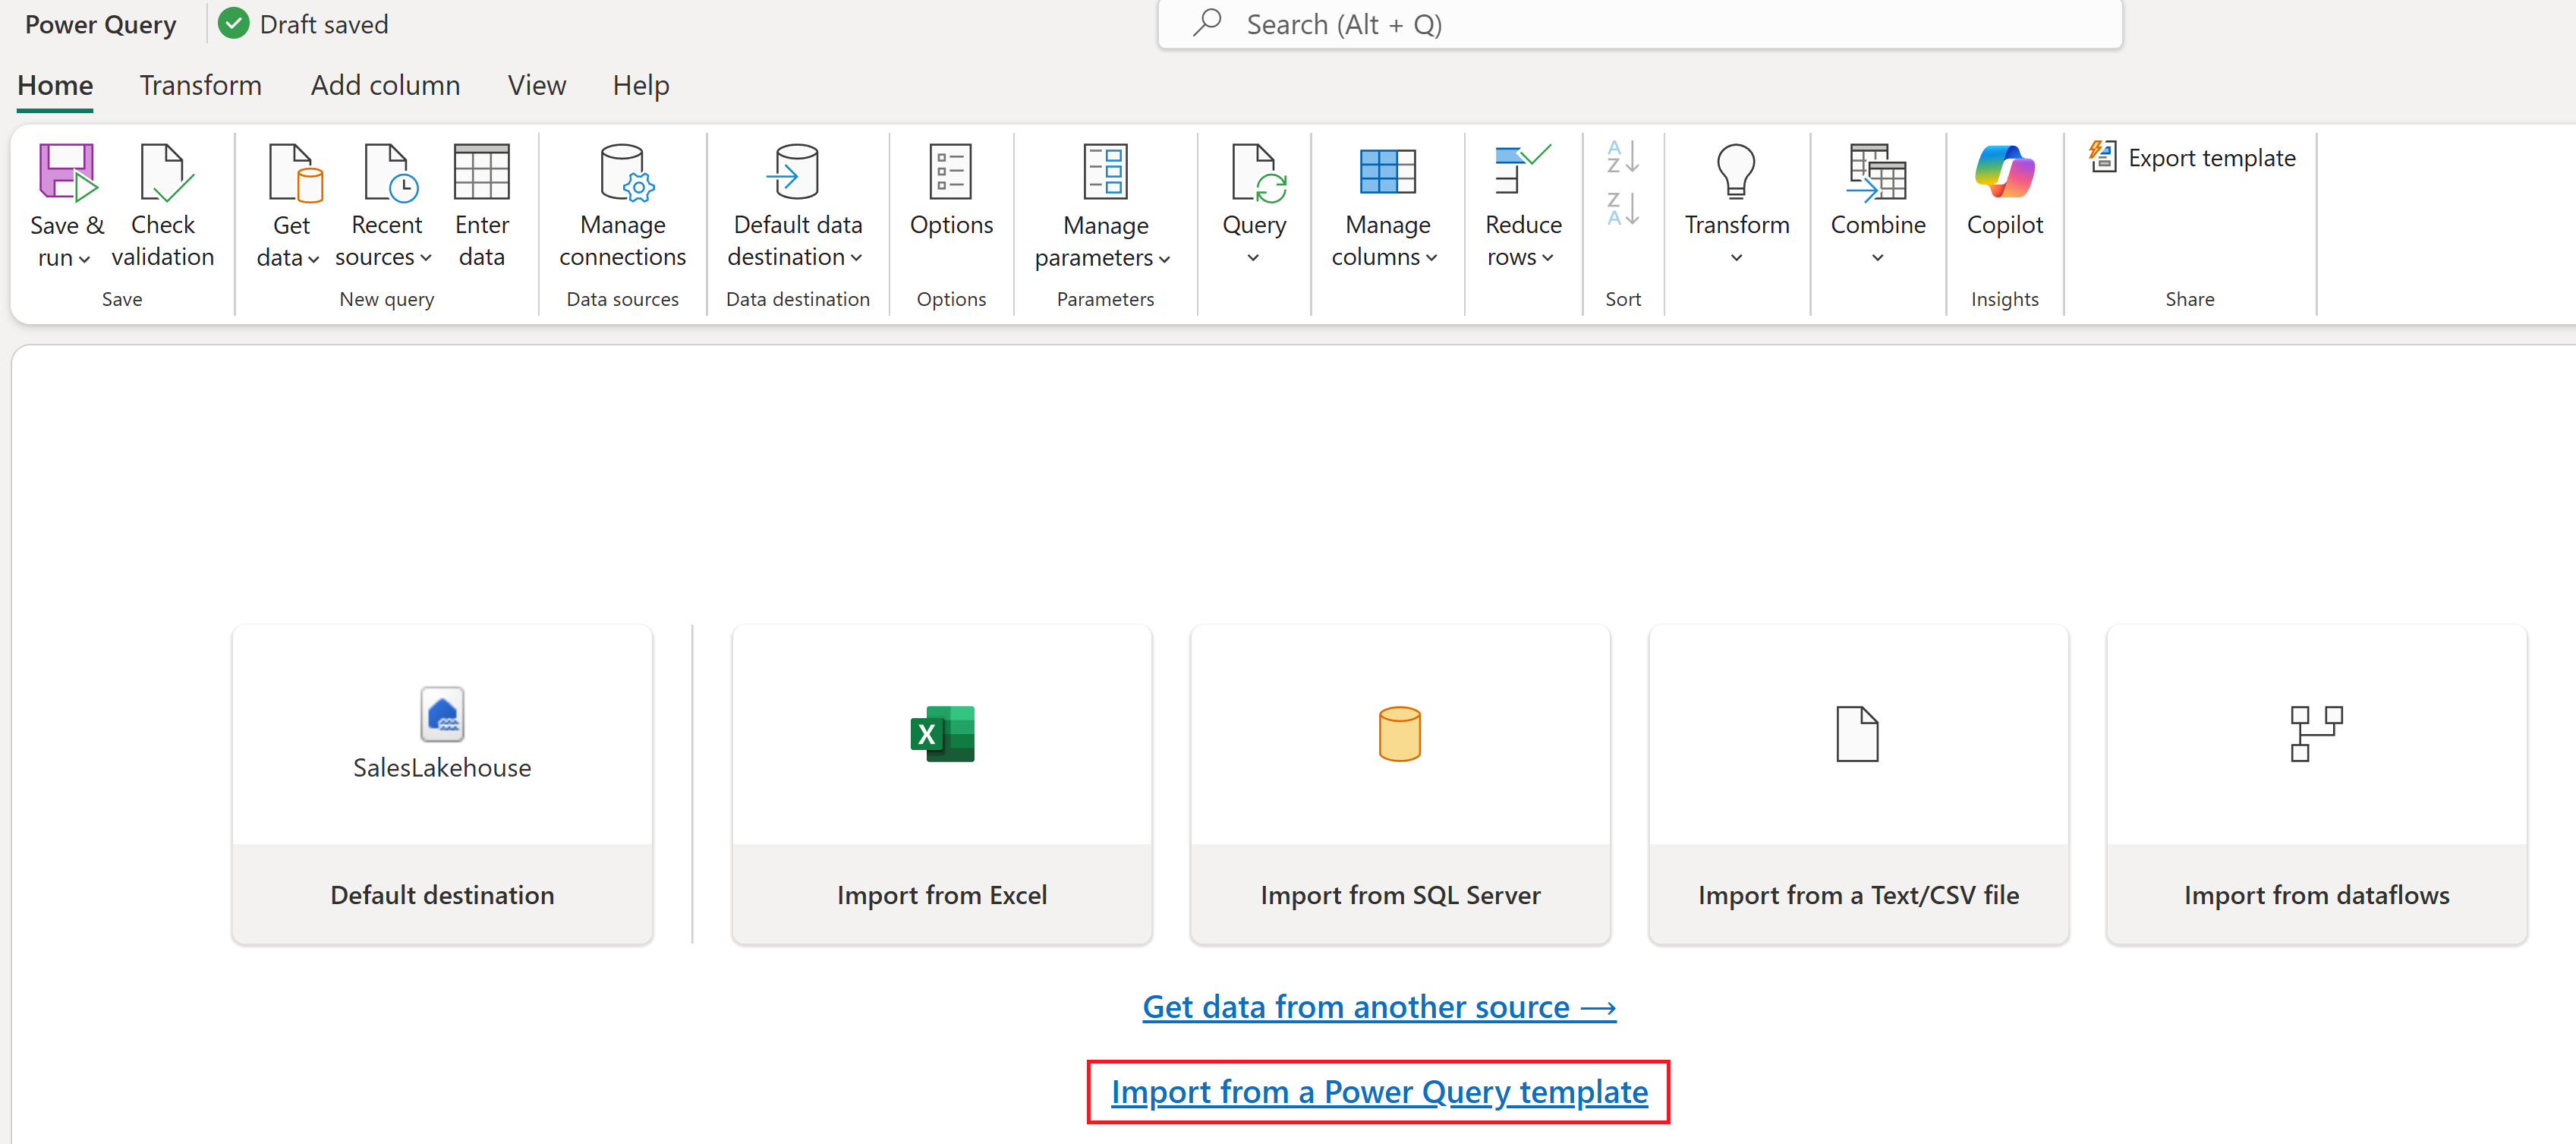
In Power Query Online editor for Dataflows Gen2, select Import from a Power Query template and choose the ContosoSales.pqt template file you downloaded in the prerequisites.
Select the DimDate query under the Data load group. If prompted, select Configure connection, set authentication to Anonymous, and select Connect.
With DimDate selected, in the data preview, find the DateKey column. Select the data type icon in the column header and choose Date/Time from the dropdown.

In the Change column type window, select Replace current.
Configure Lakehouse data destinations
Select DimDate and review the data destination settings in the lower right. Hover over the configured Lakehouse to view its properties.
The Lakehouse you created is the destination for all tables. The default update method is Replace, which overwrites previous data during each refresh.

Select the FactOnlineSales table and review its data destination settings.
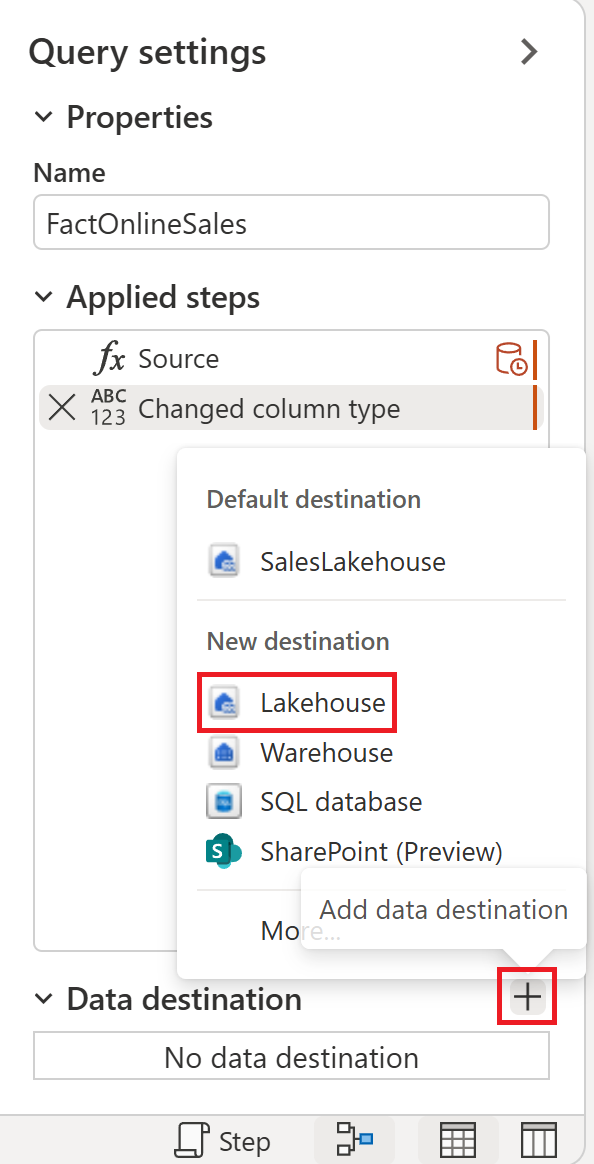
Because the FactOnlineSales source changes frequently, optimize refreshes by appending new data. Remove its current data destination by selecting the X icon. Don't remove destinations for other tables.

With FactOnlineSales still selected, select the + icon to add a data destination, and then choose Lakehouse.
If prompted, set authentication to Organizational account and select Next.
In the navigator, select your workspace and expand it to view all Lakehouse items. Select SalesLakehouse and ensure New table is selected, and then select Next.

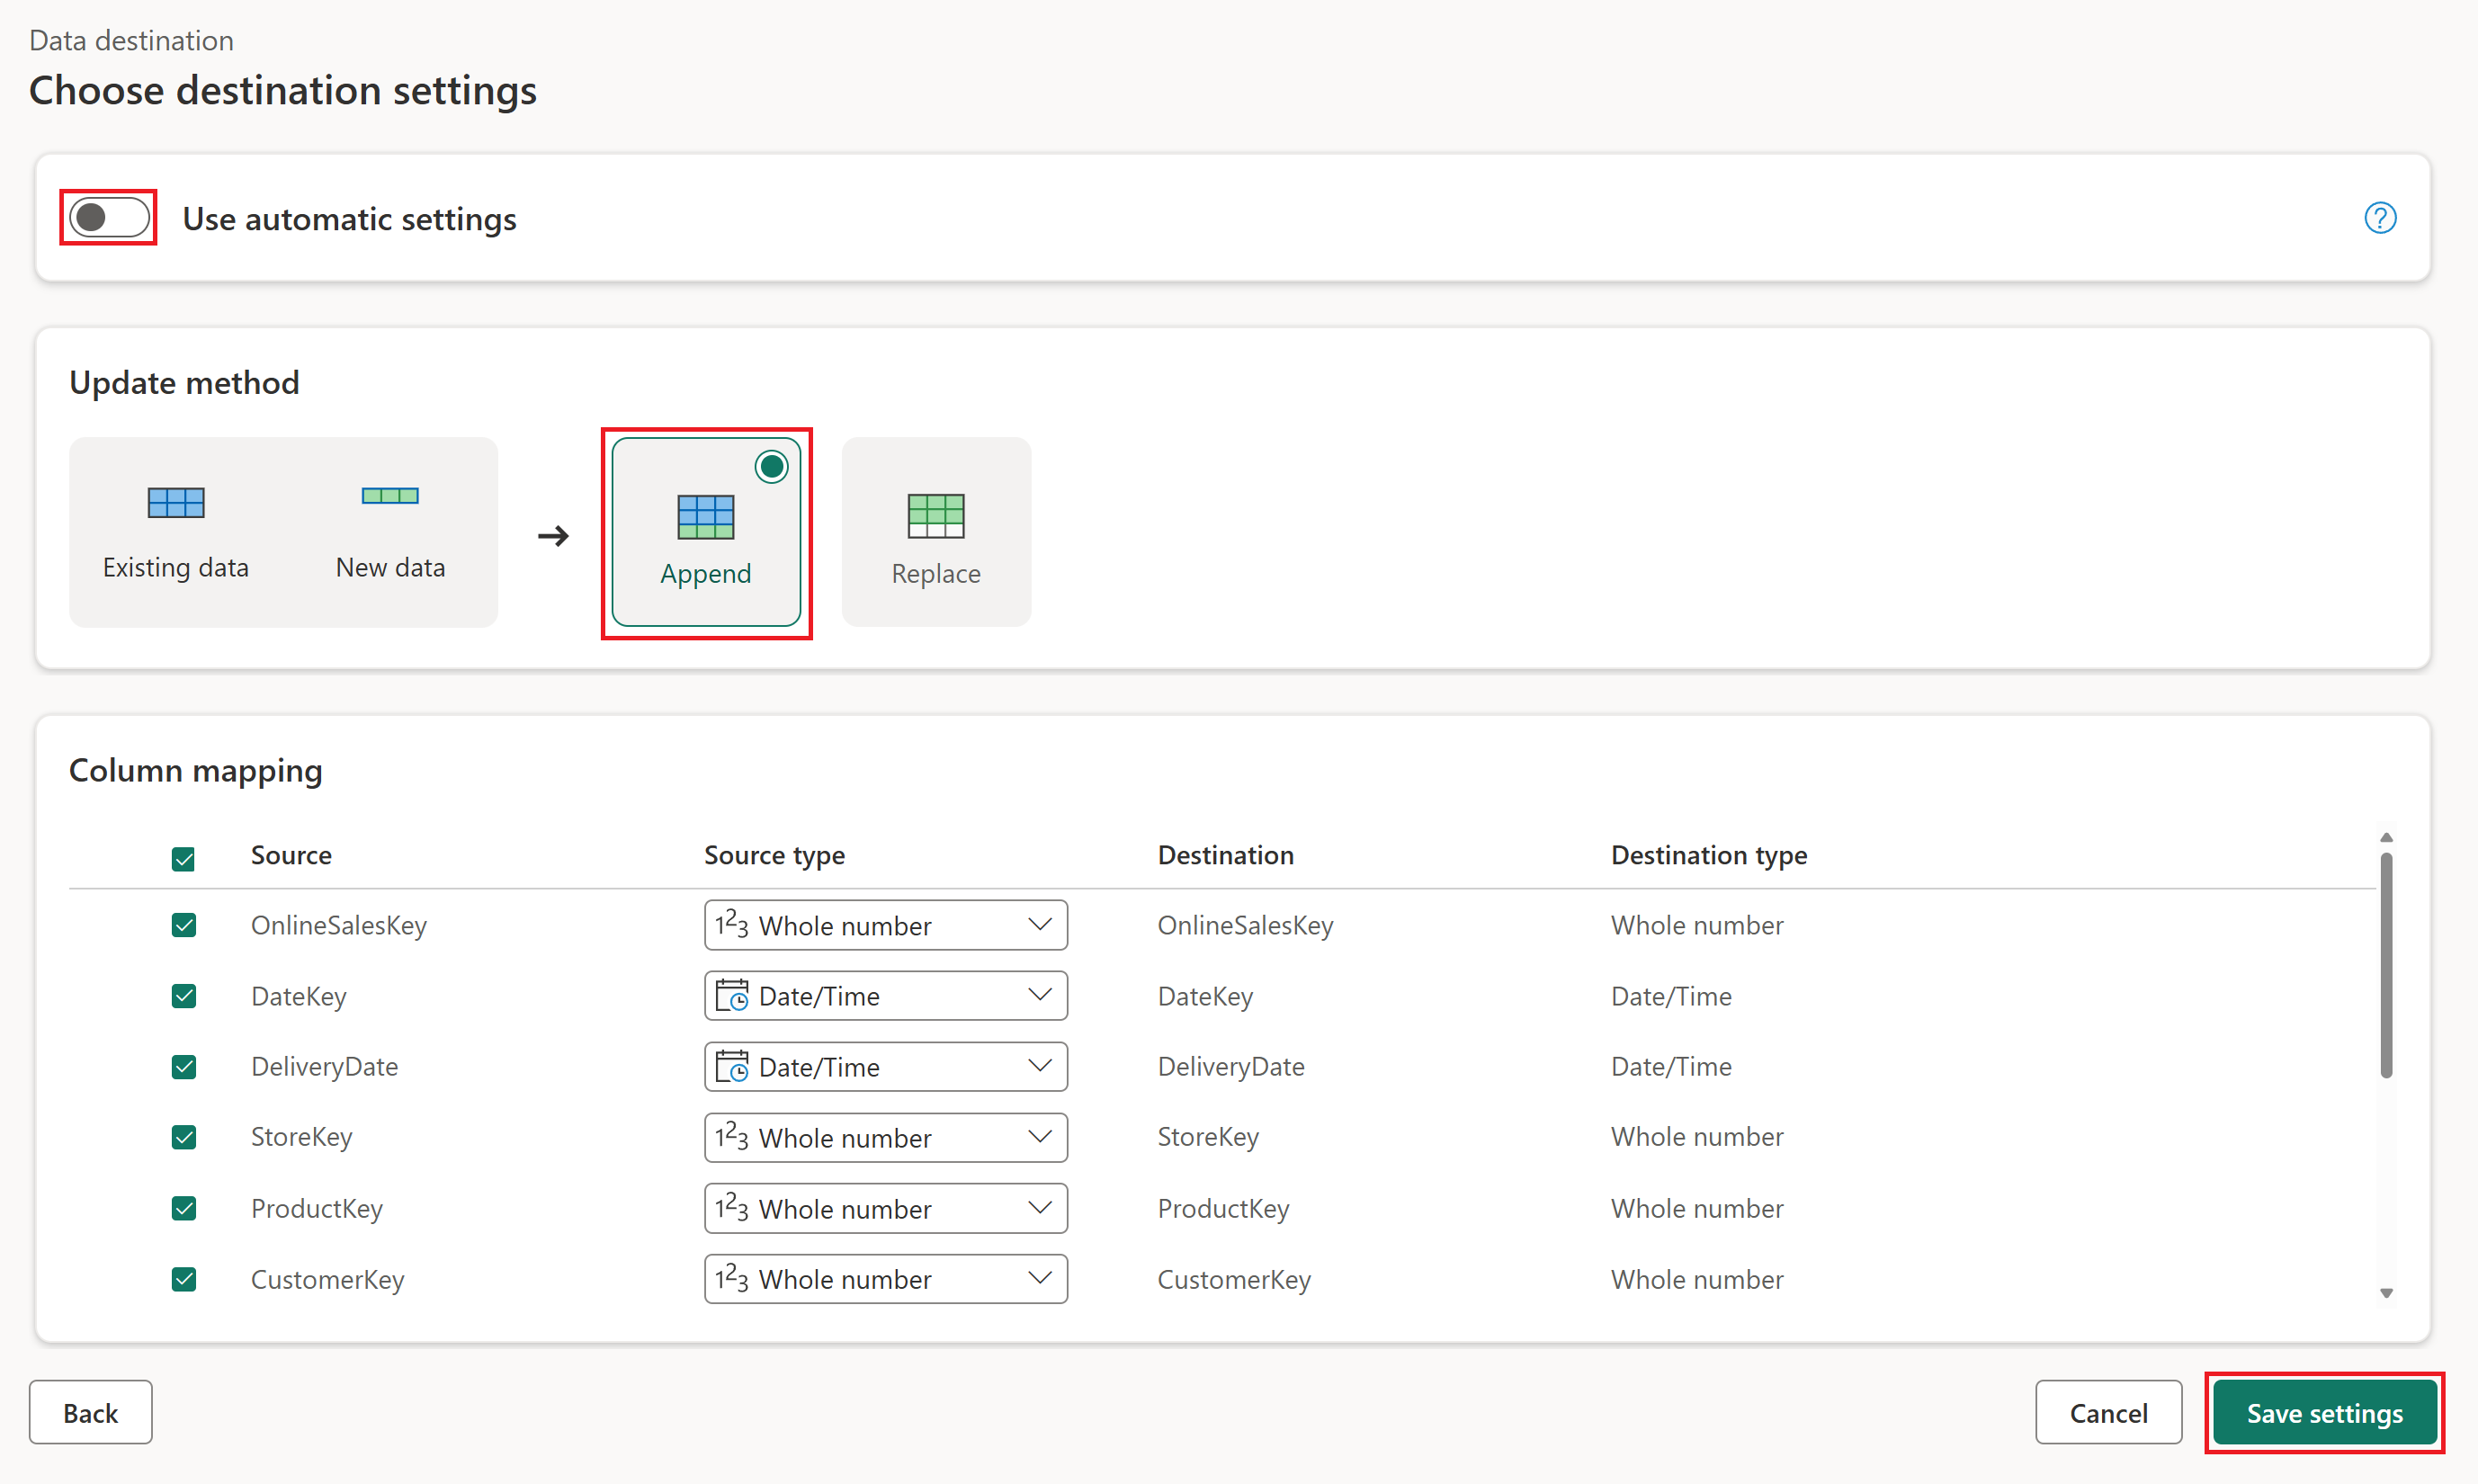
In the data destination settings panel, clear Use automatic settings, set Update method to Append, and select Save settings.
The Append method adds new rows to the table during each refresh, preserving existing data.
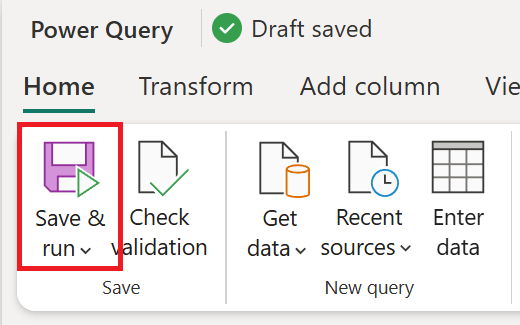
From the Home tab, select Save & run.
To exit the Power Query Online editor, select the X on the OnlineSalesDataflow item in the left side-rail.
Selecting X closes the editor but doesn't delete the dataflow.

Orchestrate a data pipeline for automated refresh
Automate the refresh of your dataflow and handle errors by sending a customized Outlook email with key details.
In your workspace, select New item.
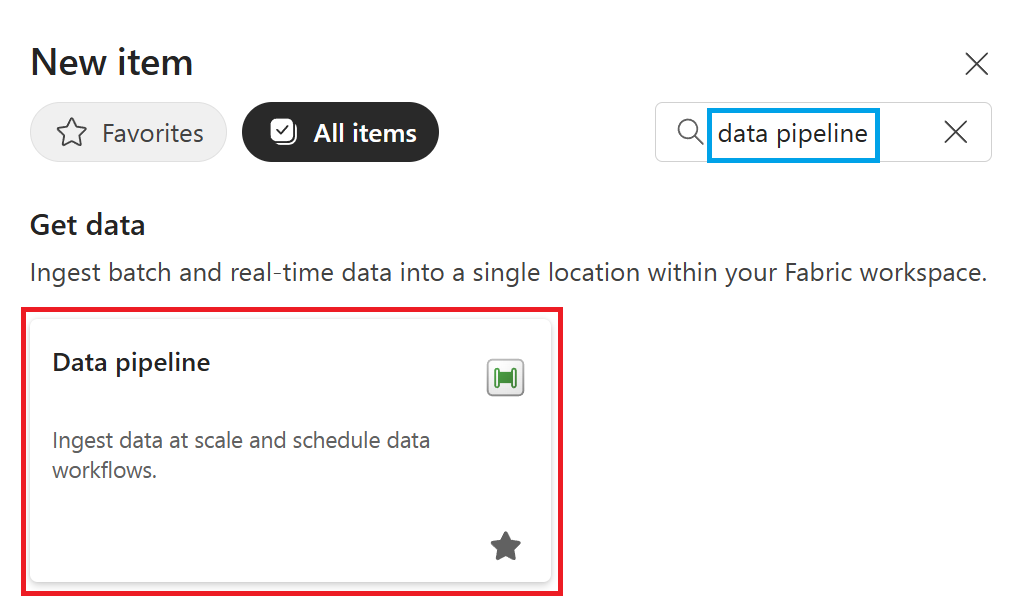
On the New item creation screen, search for or select Data pipeline.
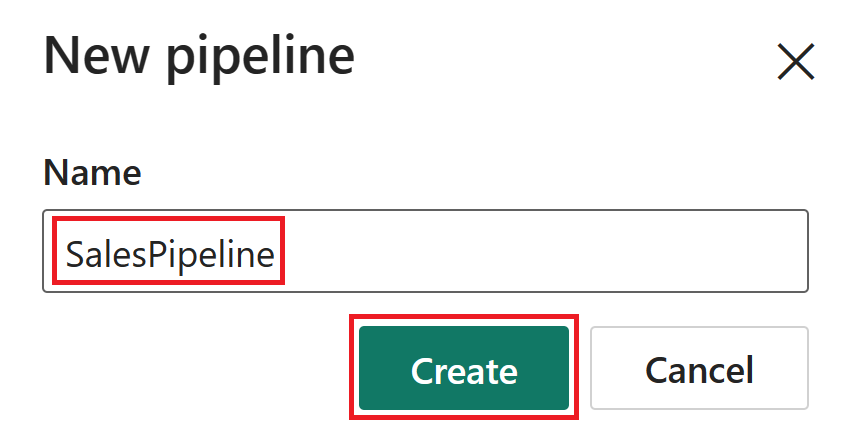
Name the pipeline SalesPipeline and select Create.
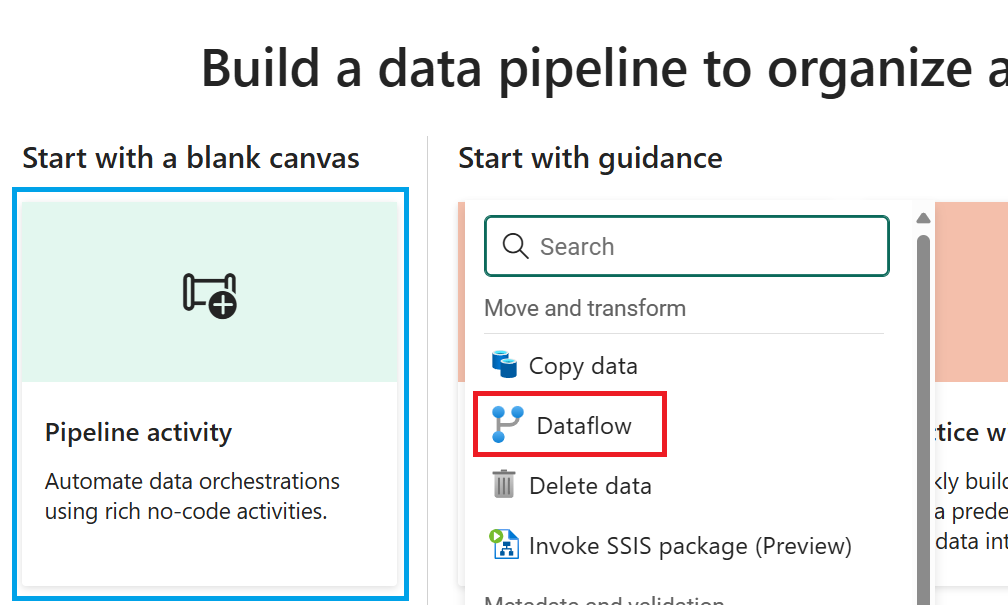
In the pipeline editor, select Pipeline activity, and then choose Dataflow.
You can also select Dataflow from the ribbon.
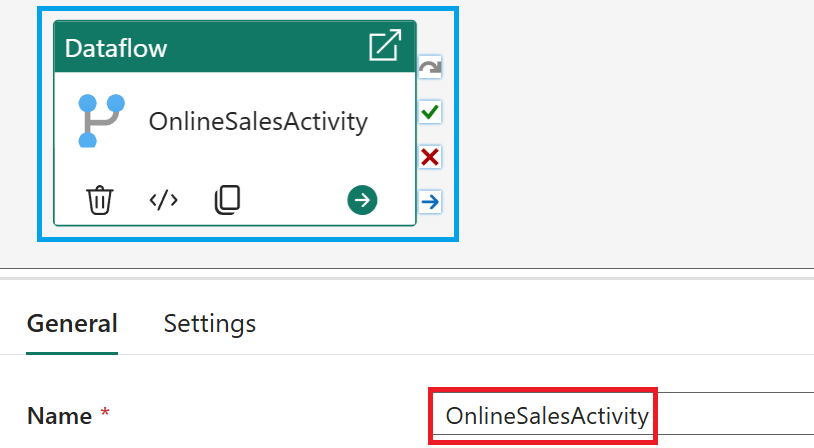
Select the dataflow activity in the pipeline editor. In the General section, set the Name to OnlineSalesActivity.
With the dataflow activity selected, go to Settings and choose OnlineSalesDataflow from the Dataflow list. If needed, select the Refresh icon to update the list.

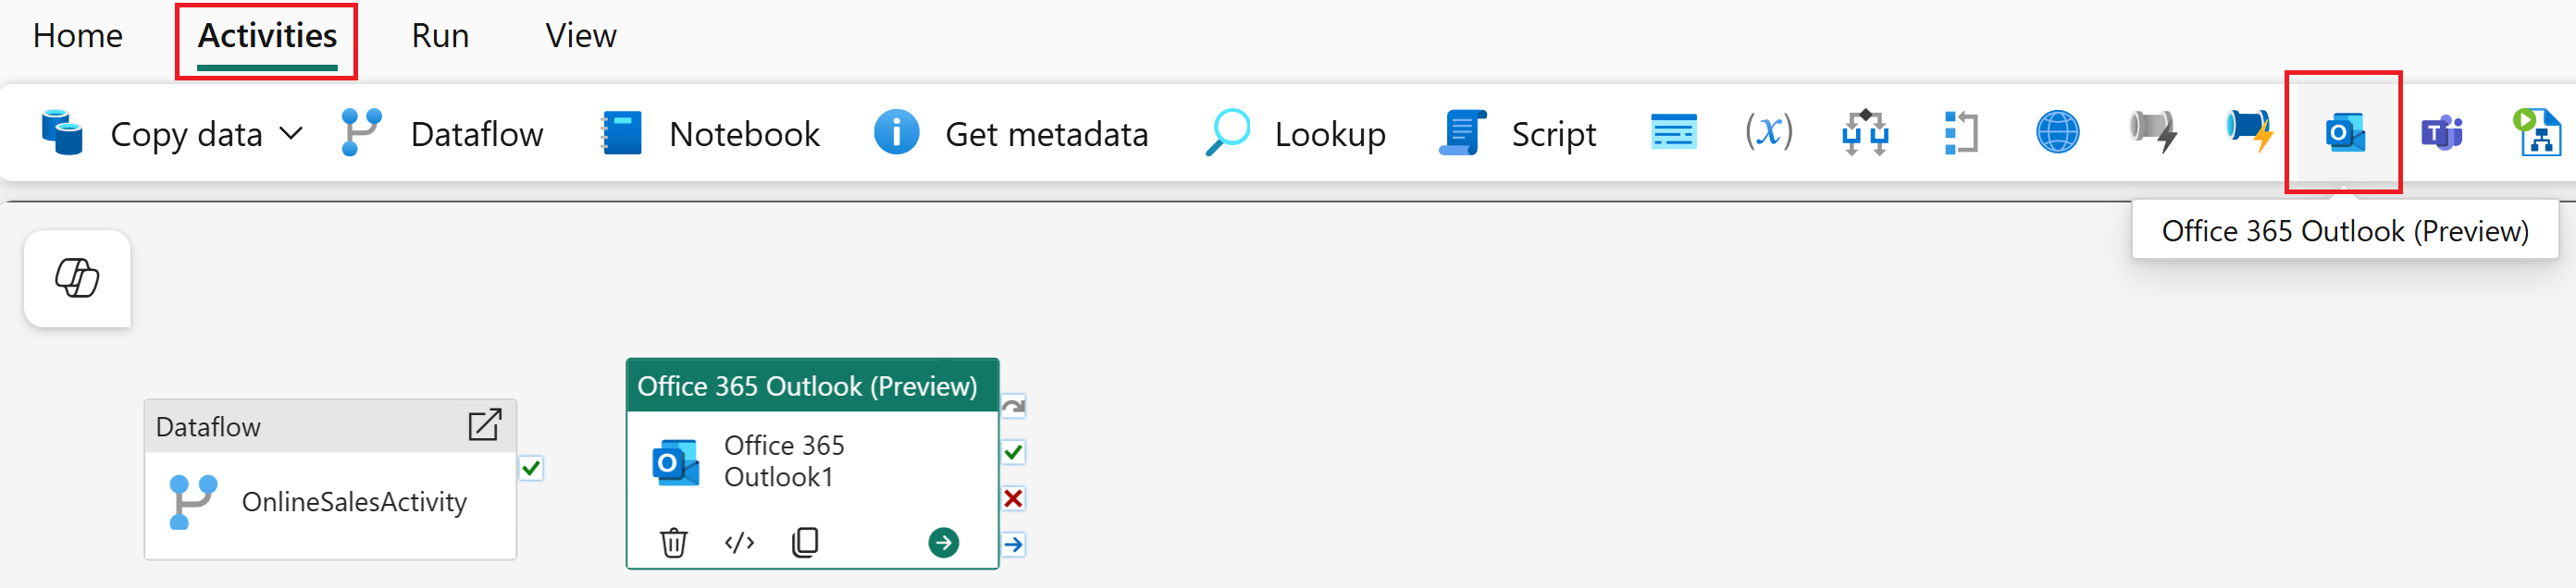
Select the Activities tab, and then add the Office365 Outlook activity.
Important
If prompted with a Grant consent window, select OK, sign in with your organizational account, and allow access.
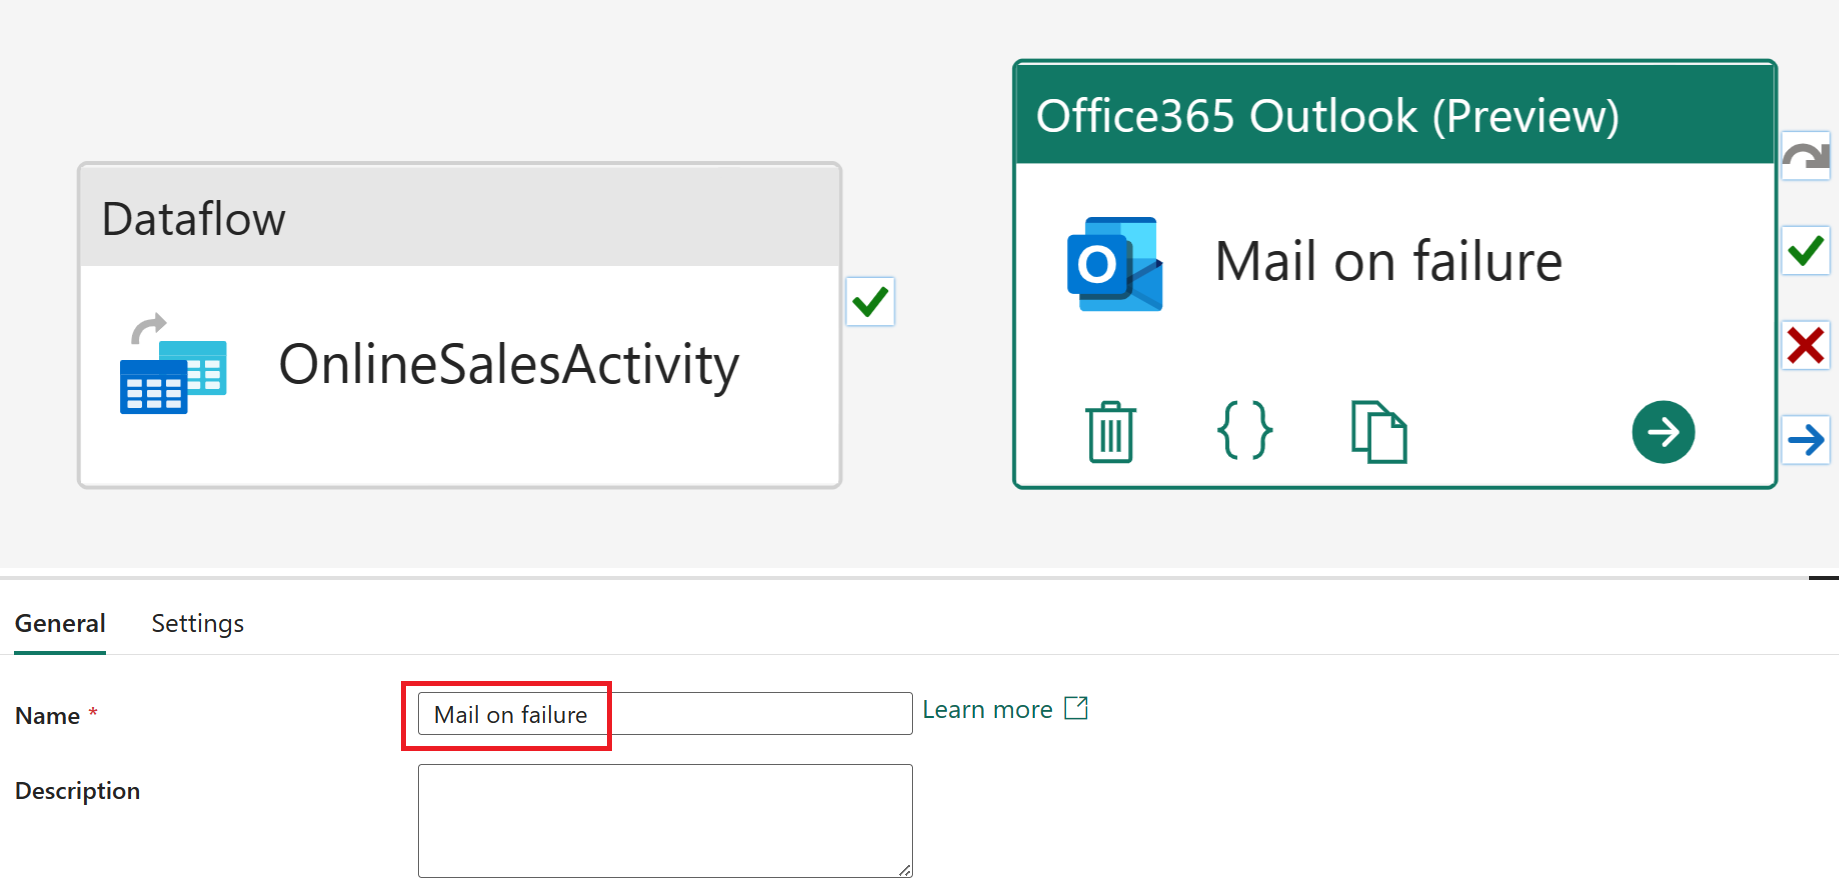
Select the Office365 Outlook activity in the pipeline editor. In the General section, set the Name to Mail on failure.
With the Office365 Outlook activity selected, go to Settings. Enter your email address in the To field and set the Subject to Pipeline failure. For the mail Body, select View in expression builder.
Additional email options such as From (Send as), Cc, Bcc, and Sensitivity label are available under Advanced properties.

In the Pipeline expression builder, paste the following expression into the text block at the top of the page:
@concat(
    'Pipeline: '
    , pipeline().PipelineId
    , '<br>'
    , 'Workspace: '
    , pipeline().WorkspaceId
    , '<br>'
    , 'Time: '
    , utcnow()
)
This expression dynamically inserts the pipeline ID, workspace ID, and the current UTC time into the email body.
In the pipeline editor, select OnlineSalesActivity. Drag from the "X" (On fail) handle and drop it onto the Mail on failure activity. This action ensures the email is sent if the dataflow activity fails.

From the Home tab, select Schedule. Configure the schedule as follows, and then select Apply:
Name Value Scheduled run On Repeat Daily Time 12:00:00 AM From the Home tab, select Run. If prompted, select Save and run to continue.
To monitor the pipeline's status, view the Output table, which displays activity progress. The table refreshes automatically, or you can select the refresh icon to update it manually.

When the status shows Succeeded, return to your workspace to continue with the tutorial.

Create a semantic model in the lakehouse
The data you loaded is almost ready for reporting. Next, use the tables in the lakehouse to create a semantic model - a metadata layer that organizes and transforms physical data into logical objects. The semantic model is designed to reflect your business structure and make the data easier to analyze.
In the workspace view, select the SalesLakehouse item.
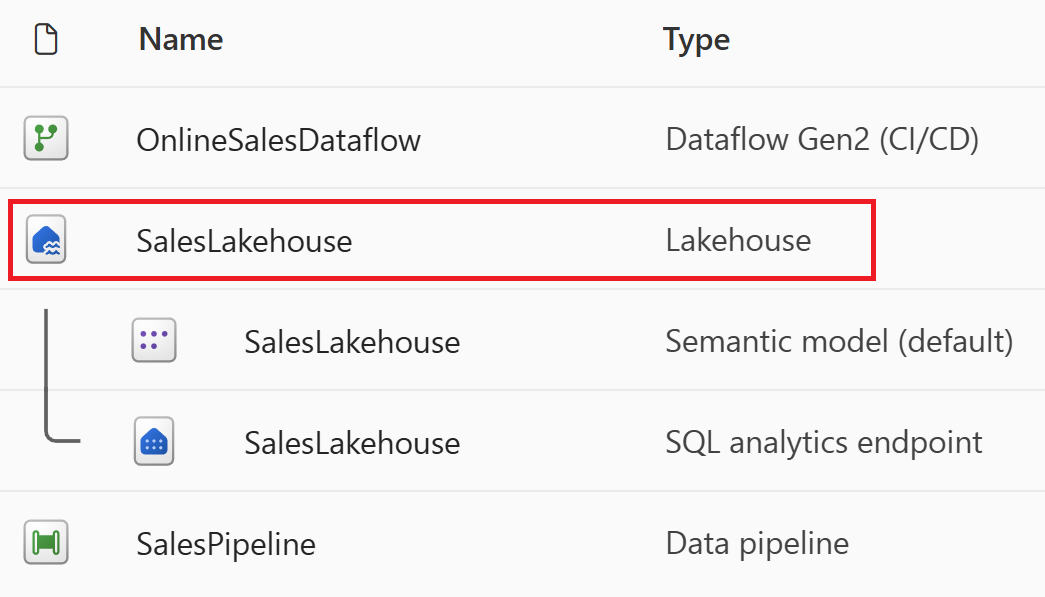
Once in the Explorer, from the Home tab select New semantic model.
In the New semantic model window, name your model SalesModel. Then, expand both the dbo schema and the Tables group. Select the following tables, and select Confirm:
Table name DimCustomer DimDate DimEmployee DimProduct DimStore FactOnlineSales 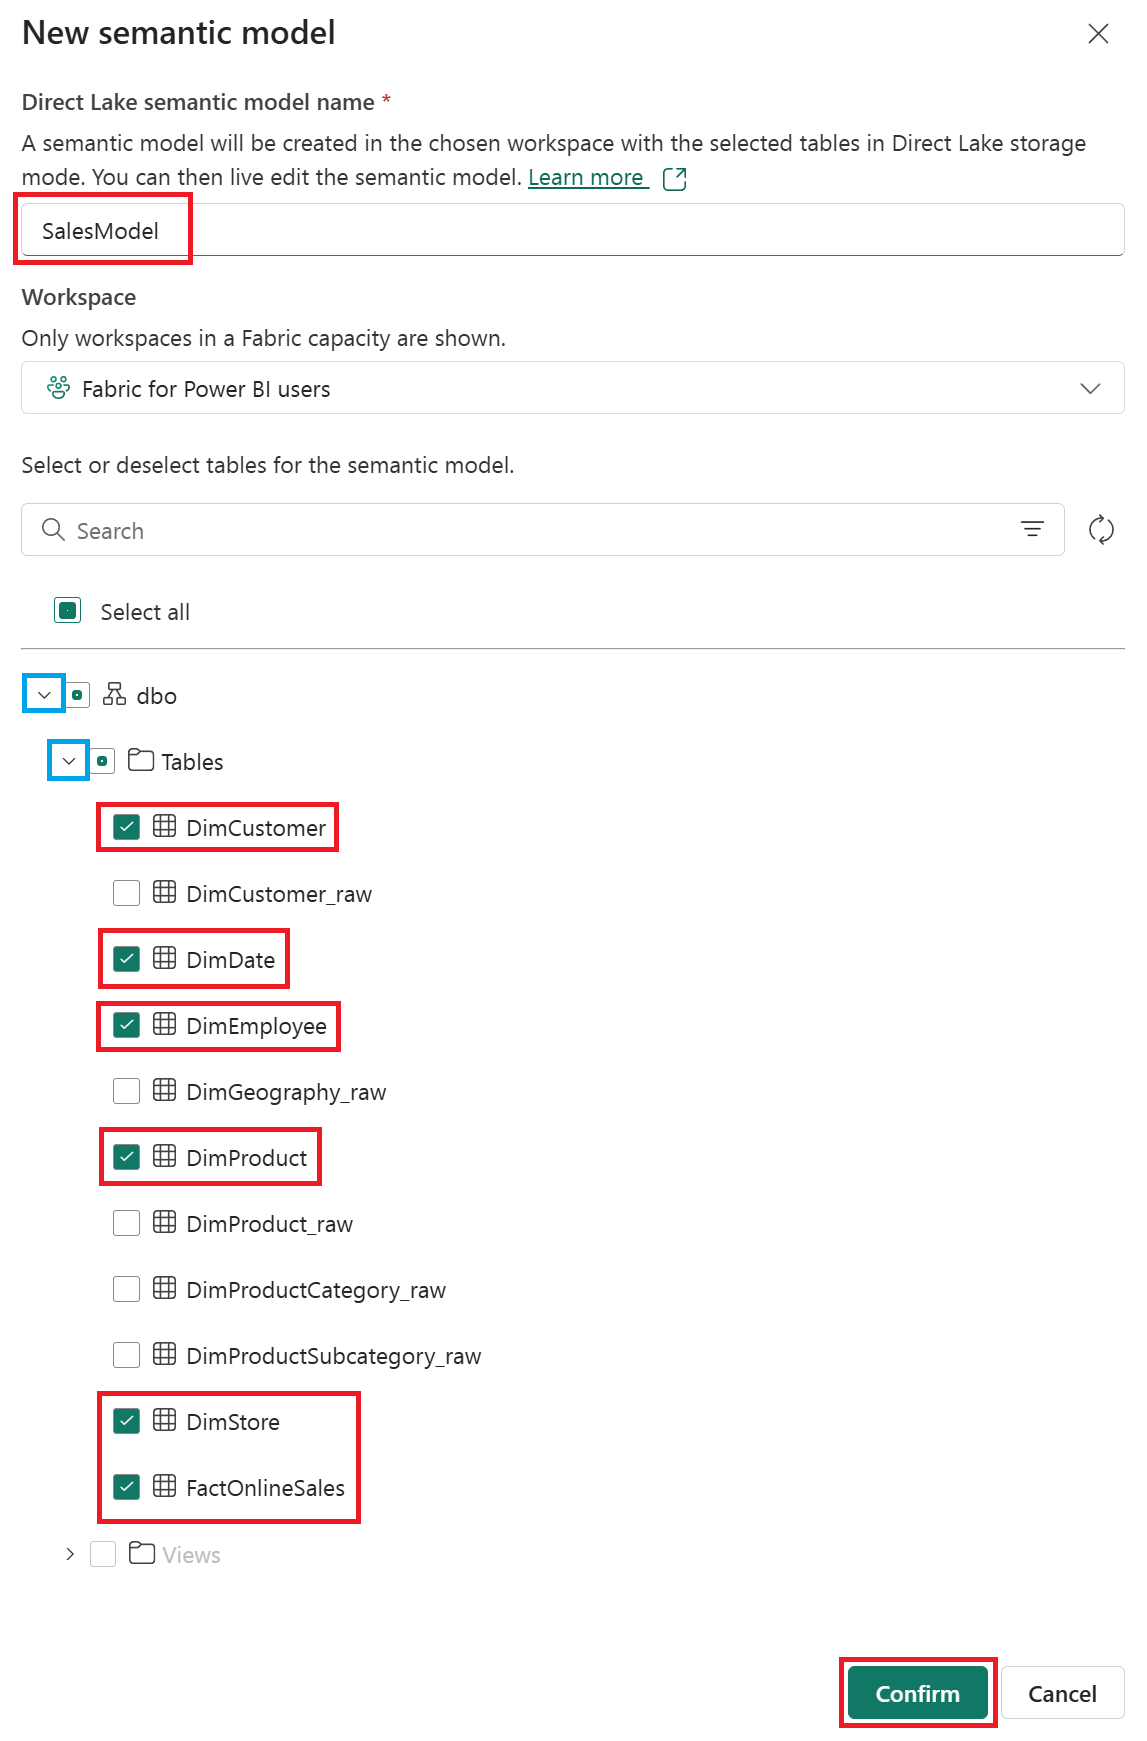
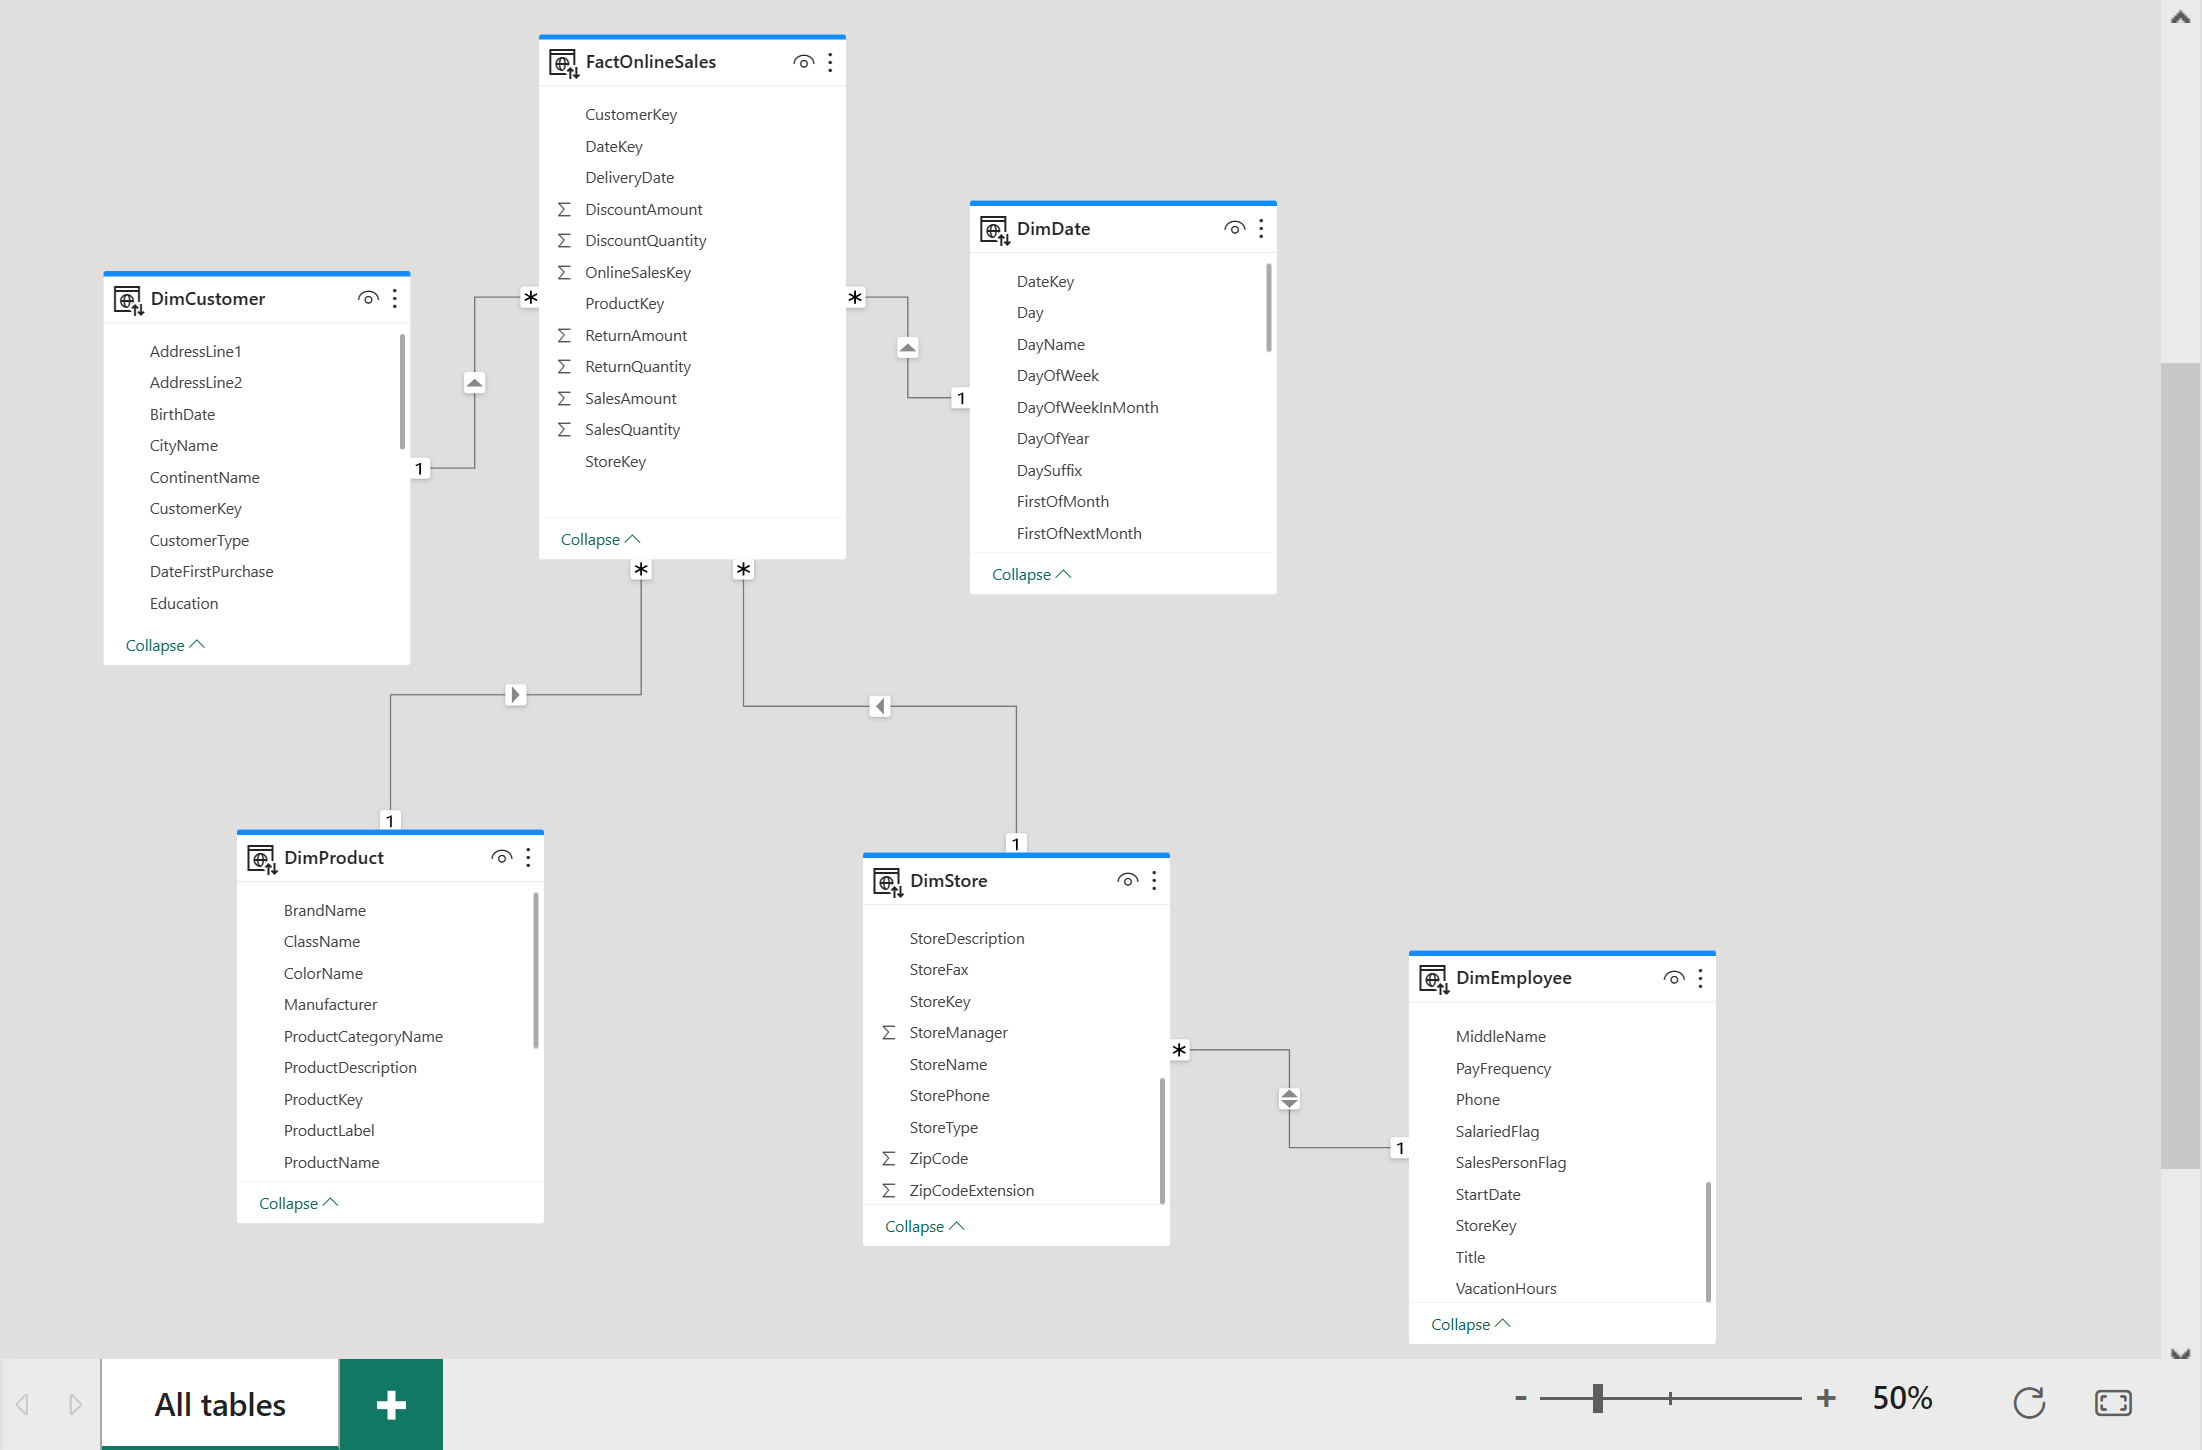
Create star schema relationships
This model uses a star schema, common in data warehouses. The center of the star is a fact table, surrounded by dimension tables, which are related to the fact table.
Create a relationship by dragging and dropping the CustomerKey column from the FactOnlineSales table to the CustomerKey column on the DimCustomer table.
In the Create Relationship window, ensure the following settings, and then select Confirm:
Make this relationship active From: Table 1 (column) To: Table 2 (column) Cardinality Cross filter direction ☑ FactOnlineSales (CustomerKey) DimCustomer (CustomerKey) Many to one (*:1) Single Repeat these steps for each of the following relationships:
Make this relationship active From: Table 1 (column) To: Table 2 (column) Cardinality Cross filter direction ☑ FactOnlineSales (ProductKey) DimProduct (ProductKey) Many to one (*:1) Single ☑ FactOnlineSales (StoreKey) DimStore (StoreKey) Many to one (*:1) Single ☑ FactOnlineSales (DateKey) DimDate (DateKey) Many to one (*:1) Single ☑ DimStore (StoreKey) DimEmployee (StoreKey) Many to one (*:1) Both The following image shows a finished view of the semantic model with all relationships included.

Create a measure in DAX
Create a basic measure to calculate the total sales amount.
Select the FactOnlineSales table. On the Home tab, select New measure.
In the formula editor, enter the following DAX measure, and then select the check mark to commit:
Total Sales Amount = SUM(FactOnlineSales[SalesAmount])
Auto-create a report
Now that you’ve modeled your data, you can quickly visualize and explore it by using quick create.
Return to your workspace by selecting it from the left side-rail. Hover over the SalesModel item, select the ellipsis (…), and choose Auto-create report.

A report is automatically generated and updates dynamically based on column selections in the Your data pane.
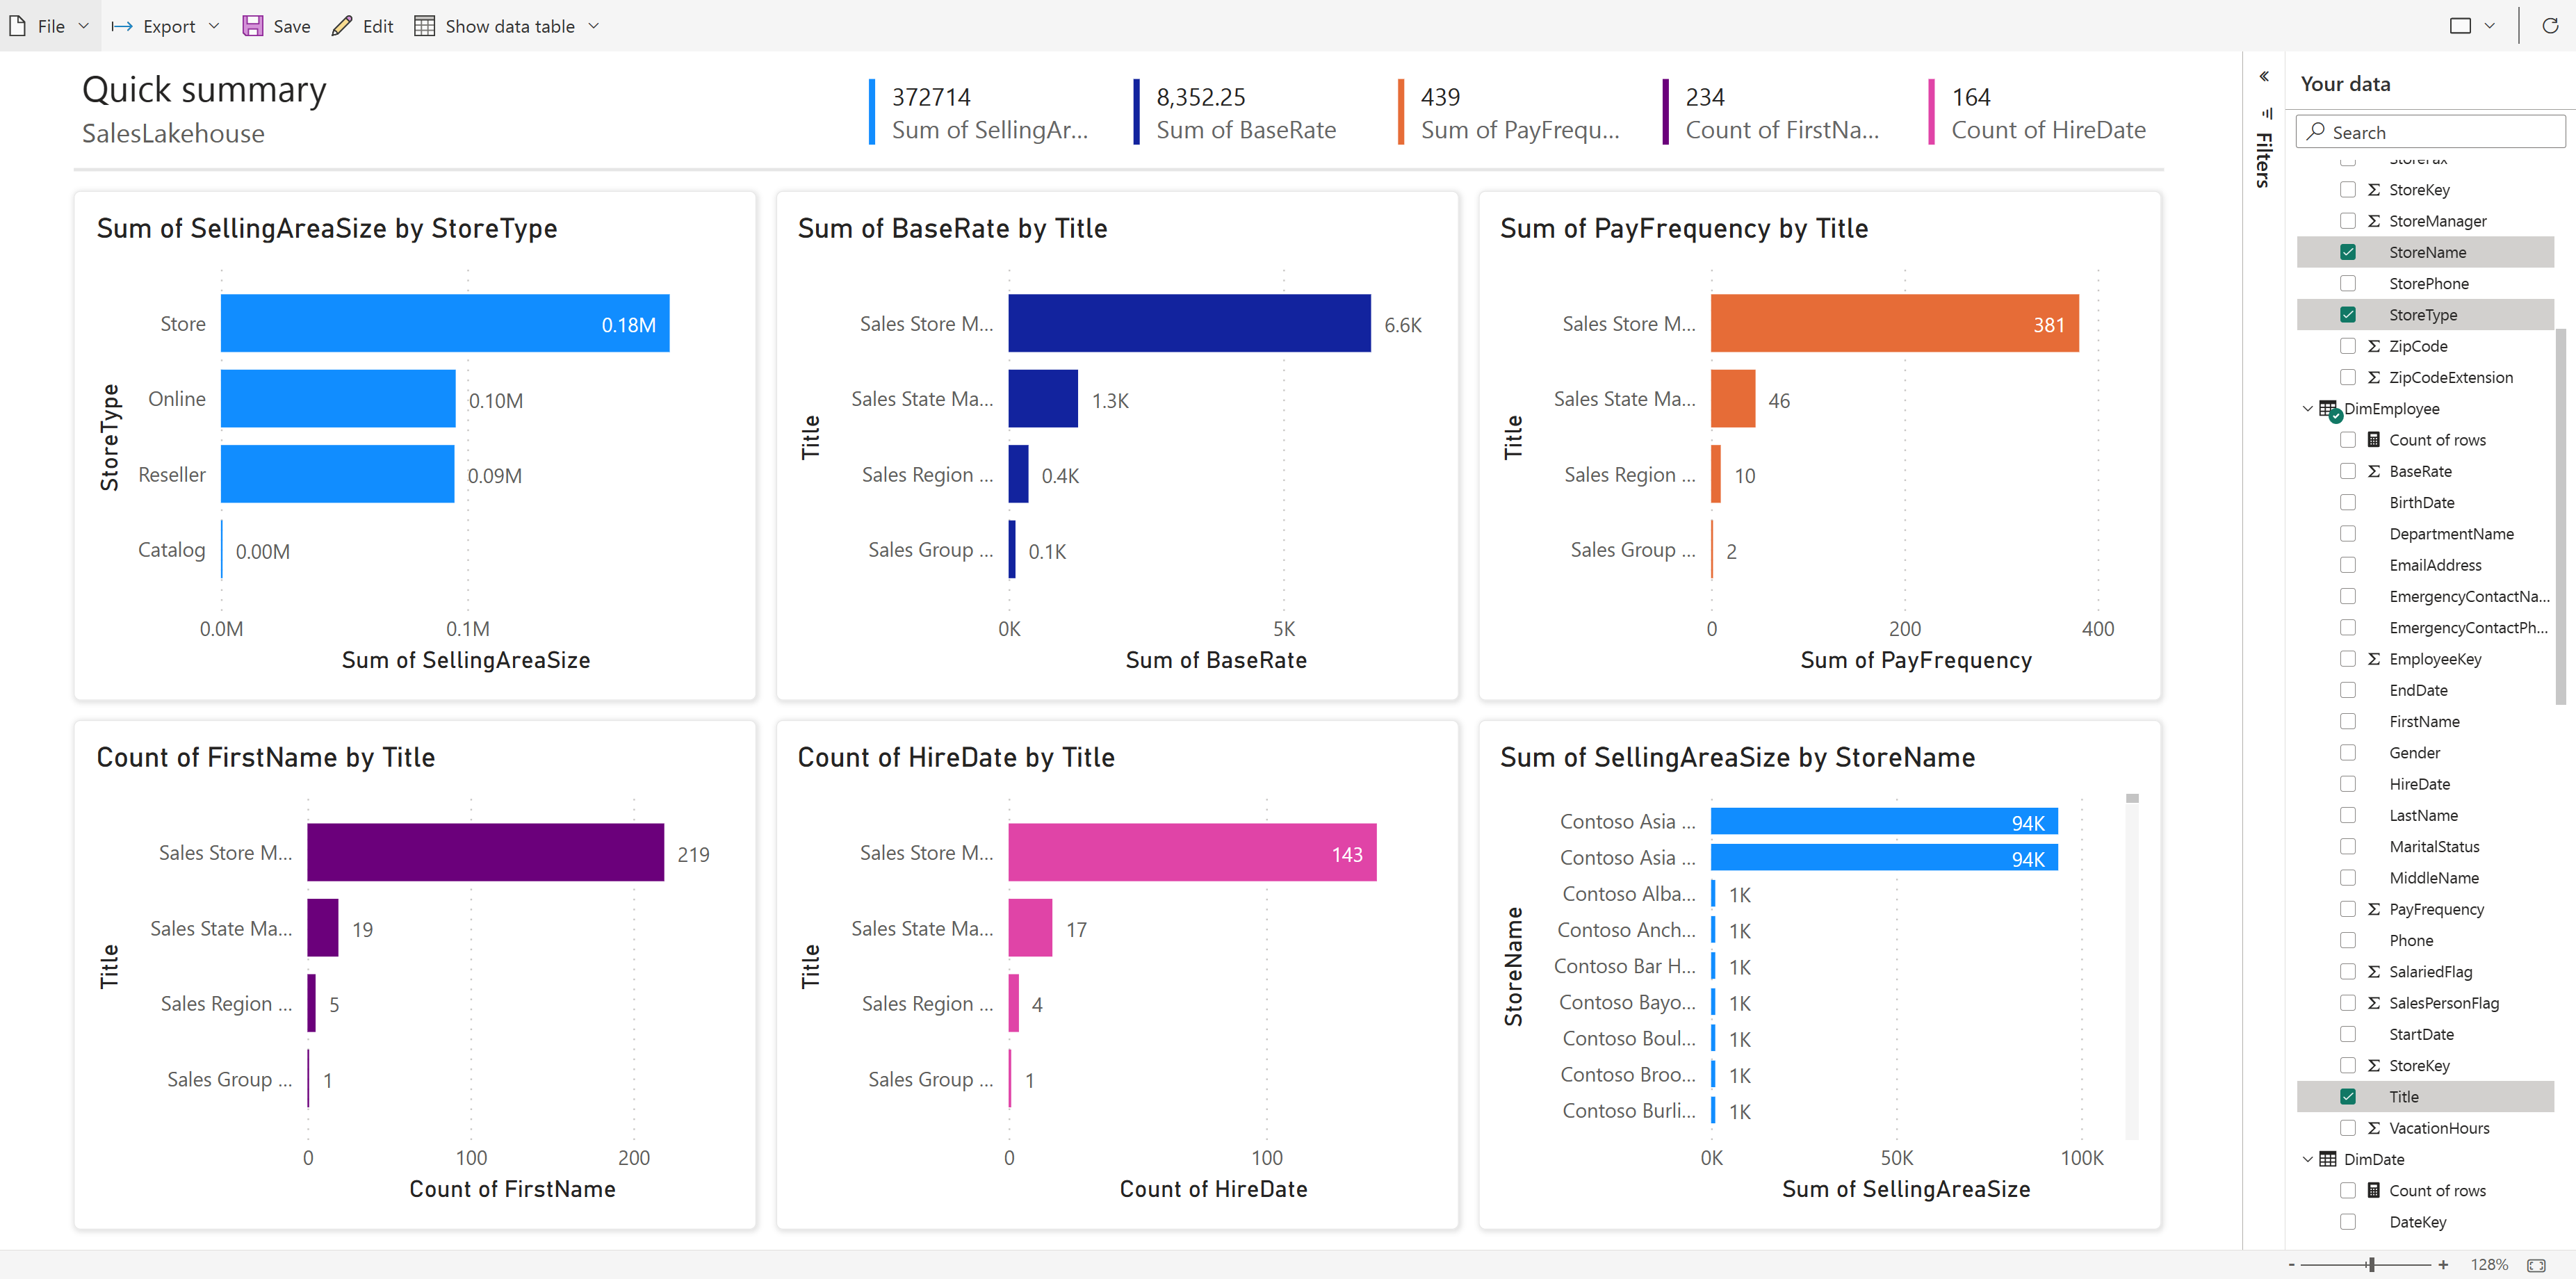
Select Save from the ribbon to save a copy to the current workspace.
Tip
To enter the full visual authoring experience, select Edit on the ribbon.

Clean up resources
If you created a dedicated workspace for this tutorial, you can delete it. Or, you can remove individual items that you created during the tutorial.